App Services in Azure make it easy to quickly spin up an environment where you can host a webapp or api, without having to manage the webserver yourself.
When running solution in the cloud the costs become very visible. This allows us to spend time optimizing the costs. One of the easiest way to reduce costs is by reducing the amount of waste. In a cloud we can define waste as resources that we pay for but are not utilizing anymore.
The case of the empty App Service Plans
If we apply this principle to App Services then one might think we can just remove the App Service when we are done with it. But many times I found Azure environments where the App Service was removed but the App Service Plan stayed around. The actual resource that you are getting billed for is the App Service Plan, so not removing that will mean you still incurr charges.
Luckily enough we can easily detect these kind of App Service Plans. My favorite method is by leveraging an Azure Resource Graph Query. Using this we can fetch all the App Service Plans that are hosting 0 sites. The below query will fetch all of these.
resources
| where type =~ 'Microsoft.Web/serverFarms'
| where properties.numberOfSites == 0
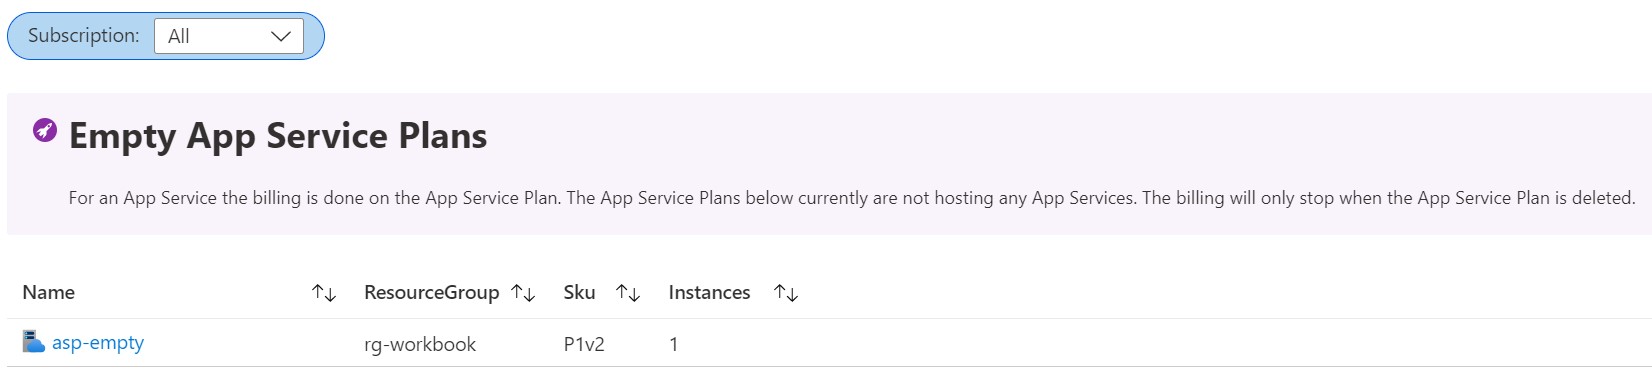
| project ResourceId = id, ResourceGroup = resourceGroup, Sku = tostring(sku.size), Instances = tostring(properties.currentNumberOfWorkers)
So when we look at the returned data you will most likely see some App Service Plans with a SKU of F1, this refers to the Free tier and does not incur any charges. For other tiers like for example P1v2 or S1 you do have to pay. The actual amount is also influenced by the number of instances. If we for example stick with a P1V2 and lookup the instance price on App Service Pricing page, this is currently 130.954 Euro’s a month per instance. So when we run 2 instances of this without any sites on there we are spending slightly over 260 Euro’s that we could have spent on something more useful.
The case of the cheaper App Service Plan tier
After eliminating waste on the App Service Plans that we use throughout the Azure environment we can also try to optimize the spend on the App Service Plans that we are actually utilizing. With the Premium tier there are 3 different versions. Newer versions are utilizing newer generations and have a different pricing model. For example if we have a P2v2 plan we would have 2 cores and 7 GB of RAM for around 262 Euros. If we would switch to a P1v3 plan we would get 2 cores and 8 GB of RAM for 222 Euros. And with the Premium v3 tier also comes the possibility of reserving capacity, with a 3-year reservation the price would go down to 133 Euro’s.
Changing from a Premium v2 tier to a Premium v3 tier depends on the availability. The steps for this migration can be found here: App Service Configure Premium tier
We can query these different types of App Service Plans using an Azure Resource Graph query and provide recommendations on which size to switch to.
resources
| where type =~ 'Microsoft.Web/serverFarms'
| where sku.size startswith 'P' and sku.size endswith 'v2'
| project Name = id, ResourceGroup = resourceGroup, Sku = tostring(sku.size), Instances = tostring(properties.currentNumberOfWorkers), RecommendedSku = iff(sku.size == 'P1v2', 'P1v3', iif(sku.size == 'P2v2', 'P1v3', 'P2v3'))
Monitoring for cost optimizations
Monitoring your environment to be cost effective and optimizing it’s cost is an ongoing effort. One way to do this is by leveraging a workbook in Azure Monitor that we can utilize for tracking the empty plans and plans where we can leverage a different size that would be more cost effective. In a perfect world the workbook would not display anything and show us that we’ve optimized the entire estate.
If you want to try out this workbook you can find it at App Service Cost Optimization GitHub Repo